Network topology design at 27,000 km/hour
Authors: Debopam Bhattacherjee and Ankit Singla @ NDAL | Systems Group | ETH Zürich
To be presented at ACM CoNEXT 2019, FL, USA
Abstract: Upstart space companies are actively developing massive constellations of low-flying satellites to provide global Internet service. We examine the problem of designing the inter-satellite network for low latency and high capacity. We posit that the high density of these new constellations and the high-velocity nature of such systems render traditional approaches for network design ineffective, motivating new methods specialized for this problem setting.

We propose one such method, explicitly aimed at tackling the high temporal dynamism inherent to low-Earth orbit satellites. We exploit repetitive patterns in the network topology such that we avoid expensive link changes over time, while still providing near-minimal latencies at nearly 2x the throughput of standard past methods. Further, we observe that the geometry of satellite constellations admits more efficient designs, if a small, controlled amount of dynamism in links is permissible. For the leading Starlink constellation, our approach enables an efficiency improvement of 54%.
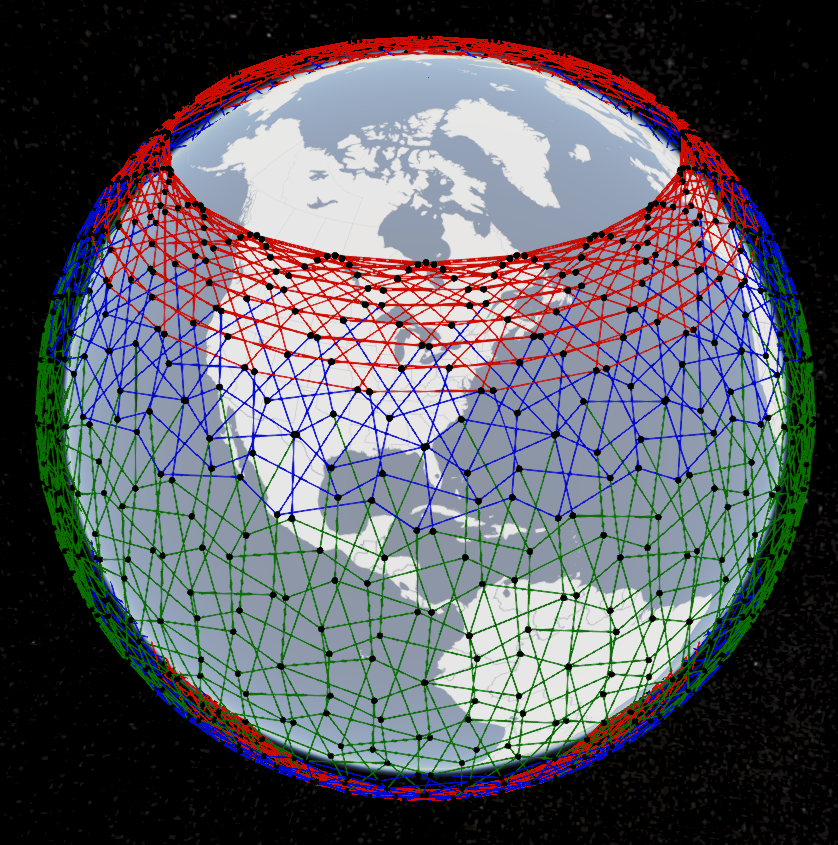
Traditional +Grid connectivity [3D] (Firefox)

Results and Animations showing motif-based ISL setup schemes for mega constellations as follows
A uniform 40x40 (402) 53° inclined constellation: This is a uniform 2π constellation consisting of 40 orbits each with 40 satellites. The inclination is 53° and operating height is ∼550 km. The (theoretical) maximum ISL length at this operating height is 5,014 km.
SpaceX Starlink Phase 1: Starlink's first phase will have 1,584 satellites, in 24 orbits (53°, 550 km), each with 66 satellites. We evaluate our motif-based approach using both (a) the maximum ISL range, with only the visibility constraint, which is 5,014 km; and (b) the minimum range necessitated by +Grid, 2,006 km. The latter represents worst-case power-limited ISLs.
Amazon Kuiper Phase 1: : Kuiper’s first phase will be a 342 constellation (51.9°, 630 km). In this case, the maximum and minimum ISL ranges are 5,440 km and 1,761 km respectively.
Other details
Traffic matrix: 1,000 most populous cities (2025 population estimates) as ground sites, with city-city traffic volume scaled ∈ [0, 1] in proportion to the population products of the city pairs. (We also examine a different workload based on economic activity in the paper.)
Hardware dependencies: The experiments will run on any general purpose computer. However, more cores would make the motif routines run faster.
Software dependencies: Experiments in this paper were run on Ubuntu 16.04 with Python 3.6.8. The Python packages used are ephem and networkx. The scripts use gnuplot 5.0 or higher (for the pdfcairo/pngcairo terminal). But if you don't have it, you can still get the result files and plot them using other software.

Motifs: Simple yet effective
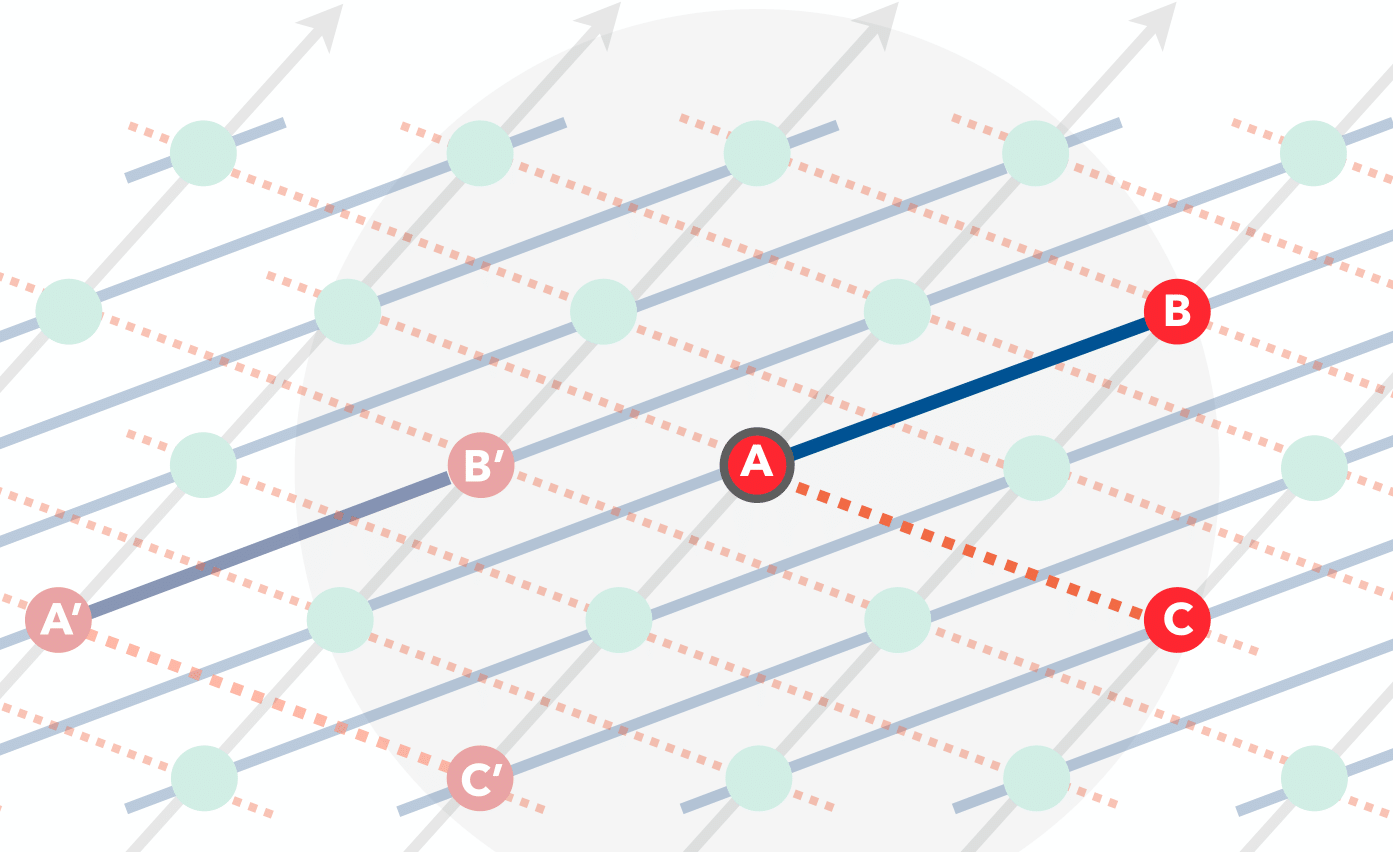
A can connect to any satellites within its view (circle). If A chooses B and C, repeating this pattern across all satellites fully specifies the constellation's ISLs. Then any satellite A′ has the same local view of its connectivity, as shown. We call such local views motifs.
How can we generate a satellite constellation with satellite positions varying over time? Here are the steps:
  1. Clone this repo: git clone https://github.com/satnetwork/satnetwork.github.io.git
  2. To understand the file/directory structure, click [here]
  3. Run the following commands:
    1. cd scripts
    2. ./01_get_time_varying_sat_positions.sh
  4. This would generate the 402 53° inclined constellation for 120 minutes. Check output at ../output_data_generated/sat_positions/
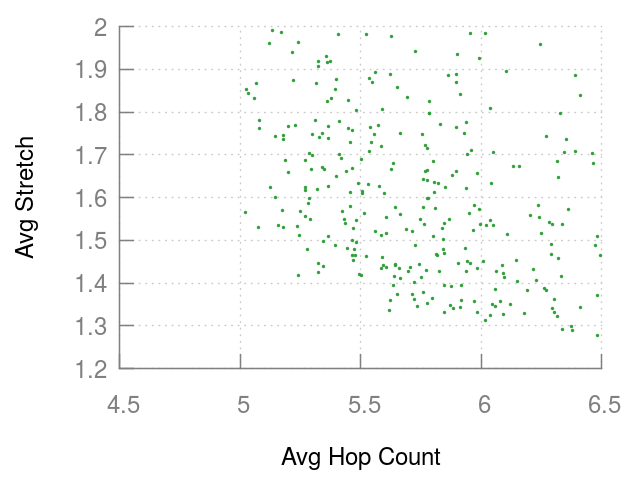
For the 402 constellation, the above figure shows the topology's average stretch and hop-count for each motif at one arbitrarily chosen system snapshot in time. The metrics are computed using the population-product traffic matrix across popular cities. For clarity, we trim the plot to leave out motifs with overly large stretch or hop count. Key take-aways: (a) Different motifs differ widely in their performance; (b) motifs expose a trade-off between stretch and hop count, with several motifs at the Pareto frontier.

+Grid provides low stretch (1.25), but with very high hop count (10.57).
Regenerate single motif metric plot from data (Fast). Steps:
  1. Clone this repo: git clone https://github.com/satnetwork/satnetwork.github.io.git
  2. To understand the file/directory structure, click [here]
  3. Run the following commands:
    1. cd output_data
    2. gnuplot plot_motif_compare.plt
  4. Check output file motif_compare.png in same directory
Regenerate single motif metric plot using scripts (Slow). Steps:
  1. Clone this repo: git clone https://github.com/satnetwork/satnetwork.github.io.git
  2. To understand the file/directory structure, click [here]
  3. Run the following commands:
    1. cd scripts
    2. ./03_generate_single_motifs.sh <core_count>
      • core_count: Number of cores to be dedicated to this routine. It takes a couple of hours with 7 cores.
  4. Check output file ../output_data_generated/motif_compare.png

Improvements over +Grid achieved by a 3-zone multi-motif
Visible range ISLs Min range ISLs
 median M1Φ1
 median M1Φ1
Starlink
5014 km52%54%
2006 km37%40%
Kuiper
5440 km38%45%
1761 km1%4%
402
5014 km45%48%
1467 km9%7%
The above table shows improvements in the M1 (median of sum of average weighted stretch and hop count across city-pairs) and Φ1 (weighted M1 sum) for Starlink, Kuiper, and a 402 constellation. The largest reductions in the metrics are for Starlink, where even with worst-case assumptions about ISL range, improvements of 37% (median M1) and 40% (Φ1) are achievable. This is due to Starlink's structure with fewer orbits and more satellites in each orbit. Fewer orbits imply that satellites in adjacent orbits are farther from each other, necessitating a higher minimum ISL range for +Grid, while a larger number of satellites per orbit imply an increased number of candidates for longer ISLs.
3D Visualization (Firefox)
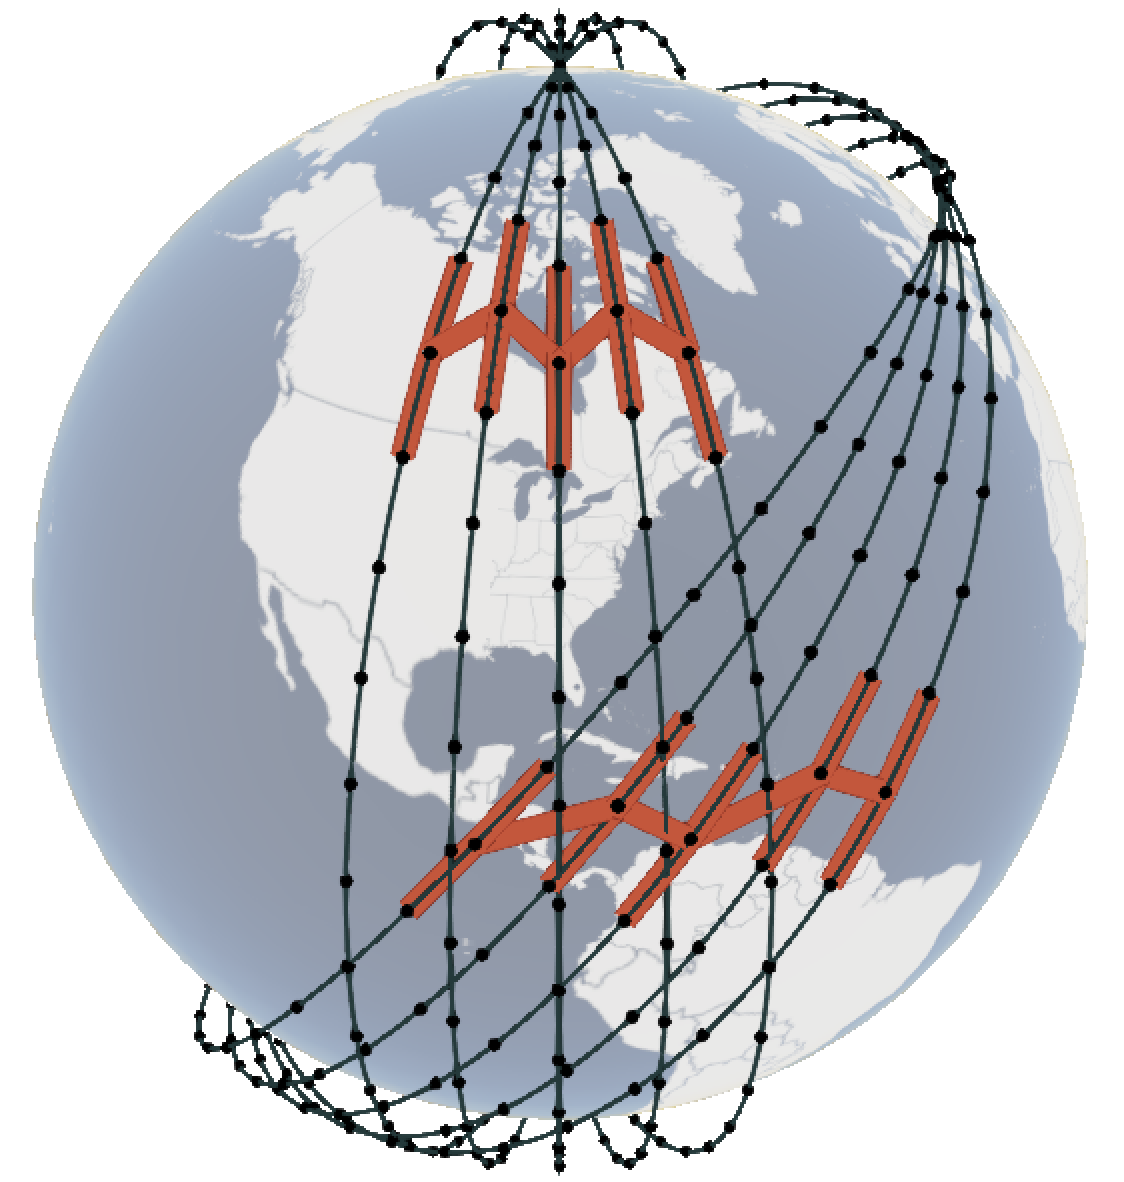
Optimal 3-zone multi-motif for a 402, 53° inclined constellation with maximum ISL length of 2000 km. Click on the image to get redirected to the interactive HTML version. Note that it might take a few to tens of seconds to load.
Regenerate data using scripts (Slow). Steps:
  1. Clone this repo: git clone https://github.com/satnetwork/satnetwork.github.io.git
  2. To understand the file/directory structure, click [here]
  3. Run the following commands:
    1. cd scripts
    2. ./04_generate_multi_motifs.sh <config> <max_isl_length> <core_count>
      • config options: 40_40_53deg, kuiper_p1, starlink_p1
      • max_isl_length options: 5014/1467 (for 40_40_53deg), 5440/1761 (kuiper_p1), 5014/2006 (starlink_p1)
      • core_count: Number of cores to be dedicated to this routine. It takes a couple of hours with 7 cores.
  4. Check output file ../output_data_generated/multi_motif/metric_improvement.txt for the Φ1 percentage improvement.
Previous publication(s)